CEA aims to help reduce emissions by decreasing energy use through energy efficiency and by increasing the use of renewable energy. The following graphs contain information about citywide emissions and energy use. While the data is from 2003, it still offers insight into where our emissions are coming from.
Total Emissions
Emissions Data
| Year | 1990 | 1998 | 2003 |
|---|---|---|---|
| Waste | 23,485 | 14,887 | 15,118 |
| Transportation | 205,855 | 218,960 | 251,929 |
| Residential | 352,432 | 309,866 | 263,227 |
| Commercial & Industrial |
582,863 | 667,355 | 951,945 |
| Total Emissions | 1,164,635 | 1,211,068 | 1,482,218 |
Relative Emissions
Emissions Sources
Figures courtesy of Community Development Department, City of Cambridge
In addition to the figures above, this map shows electricity use by census block group from 2006 to 2009.
The City is also taking steps to reduce the energy use in its municipal buildings. The graphs below demonstrate the fluctuations in energy usage and emissions from year to year, with an overall downward trend.
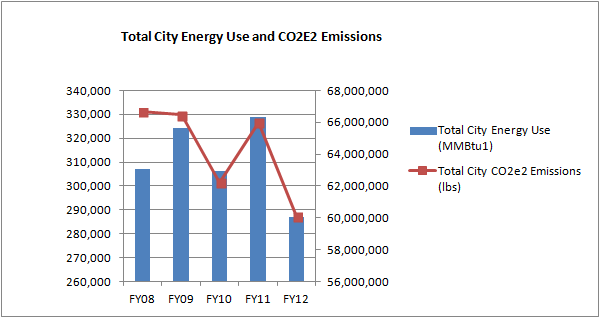
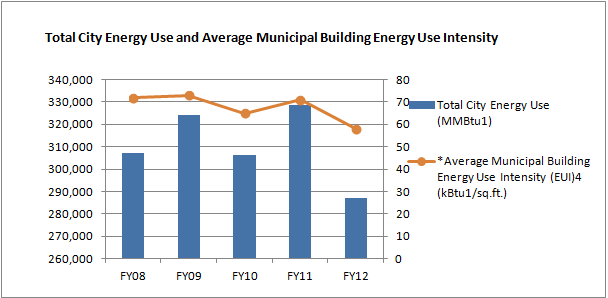
This table includes additional data about municipal energy use:
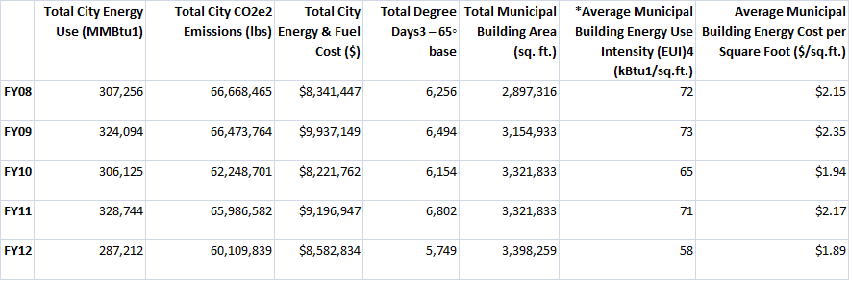
CEA Volunteer Jesse Schuh created the above municipal energy use charts and table, with data from the Cambridge Department of Public Works. For more on municipal energy use, go here.